

If we have data, let’s look at data. If all we have are opinions, let’s go with mine.
– Jim Barksdale, former Netscape CEO
To measure is to know. If you cannot measure it, you cannot improve it.
– Lord Kelvin, Mathematical Physicist
My colleague has previously posted about the nuances of creating a true partnership, as opposed to perpetuating the us-vs.-them cycle that can be indicative of a less desirable vendor-client dynamic. But what are some of the key components of being a good partner? In this next segment of Lumina’s “Navigating Successful Partnerships” series, I explore performance assessment and analysis—because one of the most important traits of a good partner is not only the ability to assess performance honestly on a regular basis, but also to make adjustments in order to ensure the relationship remains mutually advantageous.
The Importance of Unbiased Assessment: Why You Should Establish KPIs
As with any company, whether large or small, being able to accurately—with complete honesty—assess your performance allows for course-correction, adaptation, and innovation. Knowing what went well allows you to duplicate your successes and build upon them in the future. Knowing what didn’t go well allows you to prevent future mishaps, whether that’s by considering alternate workflows, staffing decisions, or something else.
Too often, a company’s reputation is only as good as its most recent, and often anecdotal, success or failure, rather than the full picture. So, how can you ensure that your company, and your partners, have a holistic view of the reality of your partnership? Enter key performance indicators, commonly referred to as KPIs.[i]
The simplest definition of a KPI is exactly what it sounds like—metrics from which you can measure success or performance. Long-term, businesses need quantitative data in order to track trends, potentially across different service areas, verticals, product types, quarters or other time periods, teams or individuals, etc. Analysis of the data gathered is likely to prove eye-opening—you may find a quarter of the year is historically problematic for your staff, or a particular team consistently performs at a higher level than another. You may even find correlations you weren’t expecting.
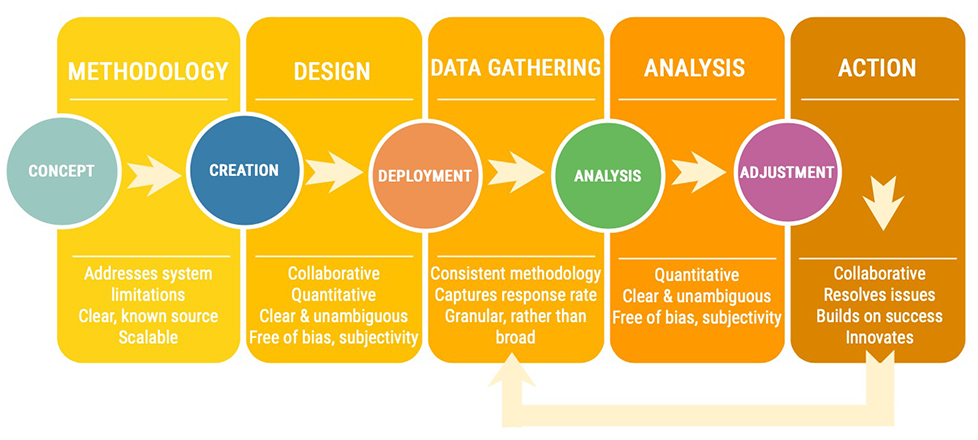
Getting started may at first seem daunting, as there are a number of factors to consider. The below graphic provides a quick overview of Lumina’s methodology, with some additional detail and recommendations in the sections that follow.
Devising—and Gathering—the Right Set of Metrics
First, let’s talk about the what—then we’ll get into the how. Which KPIs should you gather? Well… that depends. The KPIs you are interested in will vary depending on the products and/or services you offer (or more accurately, those that a particular client purchases), and more importantly what’s important to achieving your goals. Some options might include:
- Adherence to schedule
- Timing of a particular task, phase, meeting
- Staffing recruitment and/or retention
- Sales numbers (e.g., new leads, units sold, etc.)
- Profitability/Gross margins
- Adherence to budget
- Employee productivity
- Reported error or complaint rate
But again, what you choose will vary depending on your field. For example, within the content creation/revision space (my particular area of expertise), three particular metrics are key: quality, schedule, and price. These metrics are naturally closely related (for example, missing early batch deadlines may lead to a decrease in quality, as team members scramble to catch up in order to hit the original final completion date).
In many cases, the best place to start is by carefully considering contractual obligations (many contracts spell out how success will be mutually defined). Whether or not this is the case, it is vital to verify any proposed KPIs with your partner—who may feel that some should be removed, added, or modified to be more suitable for their needs.
Once you have the agreed-upon broad strokes (i.e., a general list similar to that above), consider how you will gather the data. You might be thinking, “But wait, I have my areas of interest; shouldn’t I come up with definitions before I think about how to gather them?” No, actually—before you start thinking through the details of the KPI definitions themselves, you need to consider how you will gather the data, because that will in turn impact structural decisions. For example, if you have an automatically deployed survey, consider the following how you’ll do each of the following:
- Deploy the survey (Do you have an existing system you can use? Will you create one?)
- Establish (and work around or improve upon) system limitations
- Track response rate
- Capture or gather response data
- Export data
- Analyze data
Once you’ve established the answers to the above, you’re ready to design the KPIs themselves—that is, to clearly articulate definitions that will be useful and actionable going forward. Some key considerations to keep in mind include:
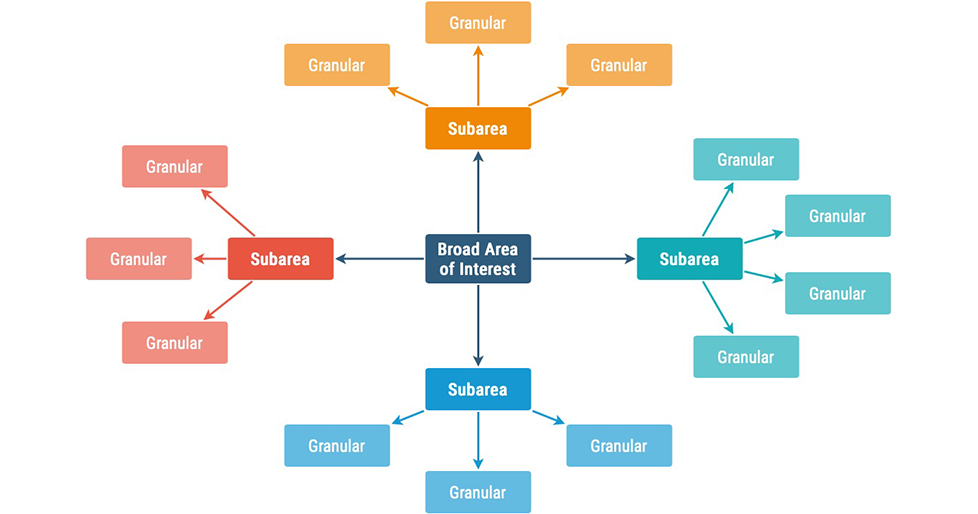
- The most granular level to which you might want to see your data. Keep in mind, you can always roll smaller categories into larger—the same is not true of the reverse. So, in crafting KPIs, it’s important to think about the smallest possible buckets in which you might want to sort your information—and build up from there.
- Bias and subjectivity: In order for information to be accurate and actionable, it cannot be biased or subjective.[i] One good—or bad—experience is not indicative of the relationship in its entirety. Objective KPIs are:
- Quantitative, rather than qualitative
- Based on a predetermined instrument, such as a survey
- Reliant on information from a wide, but clearly defined pool of stakeholders
- Consistently deployed from a clear, known source
- Captured using a deliberate, valid method (ideally via automation, as opposed to reliant on manual data collectors, who could be biased)
- Written in such a way that is clear and unambiguous, and free from bias—e.g., a survey question can’t ask about whether an experience was good, great, or amazing, with no other options; it also cannot be unnecessarily vague.
- Able to be gathered repeatedly, with later data compared against a baseline (only by asking the same questions again and again over time, can you effectively establish whether improvements are being made).
- Addressing and working within any system limitations
Analysis… and Action!
Gathering performance data is ultimately useful for one reason—to improve (or sustain) your business practices by putting feedback into context. So, having the data is nice and all… if you are appropriately analyzing it and subsequently taking the necessary action.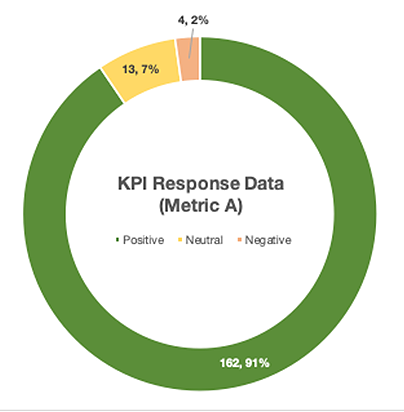
The first data set and associated analysis primarily serves as a baseline—but be aware it can also be eye-opening, and not necessarily in a good way. Thought your team was sending status reports every week? Your 85% compliance rate says otherwise. Conversely, if you’ve been hearing anecdotal evidence of negative performance across the board, your data can show that actual issues are minimal, say, less than 3% of work.[i] Either, or both, scenarios are likely to exist in the initial set of data—and that’s actually OK. You have to start somewhere, and at least now you’ll know (accurately) the lay of the land.
Next, you’ll need to look carefully at the data, and see if patterns present themselves. Using your goals as a framework, ask your yourself, where is your team succeeding? Failing? If a particular KPI is positive, why is that? How can you duplicate your success in other areas? How can you build on that success, or better yet, achieve collaborative innovation? Conversely, if a particular KPI is negative, why might that be? Are there particular teams or individuals that are a factor? Here, you must be completely honest with both yourself and your partner, as this is the only way you can implement positive change.
Whatever those findings are, you must take action. If your KPI data shows that something in particular is going awry on a fairly consistent basis, it’s a sign that changes to the process or people involved are needed. Trend reporting will provide details as to whether the changes you implement are successful. Conversely, if KPI data is consistently positive, consider what you and your teams can do to build upon that success (it truly is imperative that you do).
One Step Ahead with Predictive Modeling
Based on what you find, you might also consider predictive modeling. For example, if you know that a negative Performance Metric A has a direct impact on Performance Metric B, what can you do to change the likely outcome? What is the percentage likelihood that C will happen if A and B both occur? Here, a basic understanding of both statistics and Excel analysis tools comes in handy (predictive modeling isn’t necessarily easy to do without at least rudimentary knowledge). As you establish relationships that are predictive of future positive or negative outcomes, you can more effectively tailor your work, both current and future.
Keep in mind, though, that KPIs are only one of the pieces (even if among the most interesting and informative!) of a larger puzzle that gives structure and meaning to any successful partnership. While I personally find a data-driven approach the most useful, it remains best suited as a starting point for work that is continually evolving and improving, based on the findings of that data. What you choose to do with it is where science becomes art.
Interested in learning more about Lumina’s approach to KPI creation and analysis? We want to hear from you! Email Lumina to discuss this topic or visit our website to learn more about Lumina Datamatics.
References:
- As an aside, I have an issue with the nomenclature itself, when considering it as a measure of whether a partnership or engagement is successful. In many scenarios, KPIs have an inherently punitive design—“achieve XYZ or else”—which means that they actually perpetuate an us vs. them mentality. Instead, consider replacing KPIs with what I’m choosing to call PSMs, or partnership success metrics. PSMs should consider a holistic viewpoint—i.e., data points across both partners—rather than simply performance of one side vs. the other. Only be assessing the full flow of information and tasks can we collaboratively improve outcomes.
- To the extent possible, that is—it’s nearly impossible to avoid all subjectivity, simply because the people answering survey questions, for example, are still… well, people, and as such, have their own internal biases. And KPIs are not meant to completely replace open-ended questions/conversations, which can provide vital details not easily captured in automated surveys with pre-defined responses.
- Situations like this occur all the time, which further supports the idea of quantitative data over anecdotal. Seeing the reality of an engagement is not only important for the relationship itself, but also for morale—if team members feel that all feedback is negative, quantitative analysis that illustrates actual issue data that is low is encouraging, and reiterates that there is instead a great deal of work that all parties are actually happy with.

0 Comments